

The Buddhist Investor Portfolio - August 2021 Review
The Buddhist Investor Portfolio - August 2021 Review

Dear investor,
Welcome to The Buddhist Investor Portfolio. In this post, I’m going to review the performance of the portfolio during August.
As you probably know, my goal is to provide complete access to my portfolio decision-making. I will post monthly updates on current portfolio holdings and updates that detail each position, its weight, and returns in the portfolio.
Also, I will give my comments on any events that occurred during the month that affected the stock price of the businesses we own in the portfolio.
Let’s get started with it!
Market Overview
The month of August was a great month for the financial markets. The S&P 500 increased +3.0% during the month, following the positive trend of the last two months. As of date 08/31/2021, the S&P 500 YTD return is +21.6%
Here you have the monthly returns of the S&P 5001 for 2021:
August 31, 2021: +2.90%
July 31, 2021: +2.28%
June 30, 2021: +2.22%
May 31, 2021: +0.55%
April 30, 2021: +5.24%
March 31, 2021: +4.24%
February 28, 2021: +2.61%
January 31, 2021: -1.11%
Source: YCHARTS
The global reopening continued in August, with a number of developed markets further lifting restrictions.
On the virus front, the Delta variant continued to spread and daily cases have picked up across the globe. In Europe and the UK, the vaccination programs have meant that hospitalizations have not risen anywhere near as fast as during the last wave. In the U.S, hospitalizations have increased more sharply, raising some concerns that the link between infections and hospitalizations has not been as effectively broken there due to lower vaccination take-up.
Data out of the UK and Israel also suggests that antibody protection from the vaccines wains after six months, although protection against severe disease, and crucially hospitalization, still remains high. In response, a number of countries have announced booster programs to deliver third doses to their populations.
Below you can see the stock market returns worldwide:
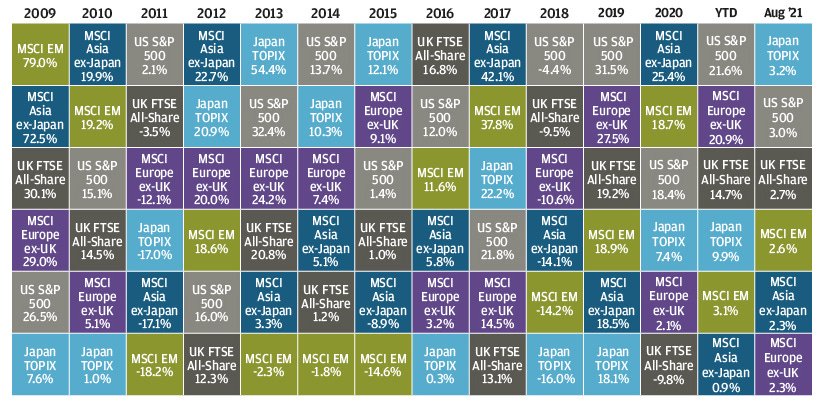
Source: JP Morgan Asset Management
The Overall Picture
Here is the information related to The Buddhist Investor (BI) Portfolio in € as of August 31, 2021:
Monthly Return: +6.38%
YTD Return: +34.11%
LTM Return: +45.89%
The composition of the BI Portfolio at the end of August was as follows:
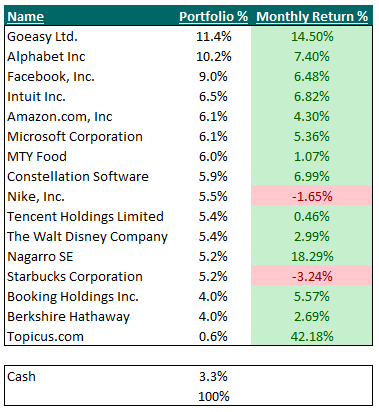
At the end of August, the TOP 5 positions in the portfolio were:
Goeasy Ltd (11.4.%): +14.50%
Alphabet, Inc (10.2%): +7.40%
Facebook, Inc (9.0%): +6.48%
Intuit Inc (6.5%): +6.82%
Amazon.com (6.1%): +4.30%
My TOP 5 positions accounted for 43.2% of the overall portfolio.
In comparison with the last month, Amazon.com joined the TOP 5 positions of the portfolio, whereas MTY Food couldn’t make it and stayed out.
As you probably know, my portfolio risk management is very simple. The stocks I own, need to earn their higher allocation in my portfolio, they have to earn that privilege. I like that because my portfolio is being concentrated for me in the biggest winners and the biggest losers become less relevant.
The best performers of the month were Topicus.com -> +42.18% and Nagarro SE -> +18.29%. Nagarro SE has been included in the category of best performers of the month for 3 months in a row. From the beginning of June to the end of August, its accumulated return was +59.3%
The worst performers of the month were Starbucks Corporation -> -3.24%, and Nike-> -1.65%
Also, I keep 3.3% of cash to have optionality in case future opportunities arise.
Goeasy Ltd
Monthly Return: +14.50%
YTD Return: +100.31%
LTM Return: +199.31%
Goeasy represents the largest position in the BI Portfolio with a percentage of 11.4%.
At the beginning of the month, Goeasy’s stock price was 171 CAD and it closed the month of August with a stock price of 195.78 CAD, which represents a +14.5% increase. For the last 3 months, the stock price is up +28.67%
Goeasy reported record results for the 2Q 2021. The Company experienced an increased level of demand within its direct-to-consumer lending channels, aided by strong growth in its point-of-sale finance channel.
Also, increased originations and loan growth, complemented by improved credit performance and the April 30, 2021 closing of the previously announced acquisition of LendCare Holdings Inc. (“LendCare”), led to record financial results.
Here you have what Jason Mullins Goeasy’s President and CEO said about the quarter: The second quarter was highlighted by a significant increase in loan originations, continued strength in the credit performance of our portfolio, and the expansion of our point-of-sale lending channel through the acquisition of LendCare. As we have now entered a period of accelerated growth, revenues lifted 34%, while adjusted diluted earnings per share rose 38%.
Key Takeaways from Q2:
Loan Portfolio of $1.80 billion, up 58%
Revenue of $202 million, up 34%
Net Charge Off Rate of 8.2%, down from 10.0%
Adjusted Quarterly Net Income of $43.7 million, up 50%
Adjusted Quarterly Diluted Earnings per Share of $2.61, up 38%
Securitization Facility Increased from $200 million to $600 million, with an interest reduction of 110 bps.
If you want to know my thoughts and analysis about the quarter, last month I wrote a post where I examined the results presented by the company.
Check it out here: Goeasy Q2 2021 Earnings Review
Alphabet Inc
Monthly Return: +7.40%
YTD Return: +64.43%
LTM Return: +74.85%
Alphabet represents the second-largest position in the BI Portfolio with a percentage of 10.2%
At the beginning of the month, Alphabet’s stock price was 2,694.53 USD and it closed the month of August with a stock price of 2,893.95 USD, which represents a +7.4% increase.
At the end of July, the company reported its Q2 2021 results and crushed analysts’ estimates. During August the stock price continued with the positive momentum following the great performance of the business. For the last 3 months, the stock price is up +20.30%
Facebook, Inc.
Monthly Return: +6.48%
YTD Return: +38.09%
LTM Return: +28.43%
Facebook represents the third-largest position in the BI Portfolio with a percentage of 9.0%
At the beginning of the month, Facebook’s stock price was 356.30 USD and it closed in August with a stock price of 379.38 USD, which represents a +6.48% increase.
At the end of July, the company reported its Q2 2021 results and beat expectations. However, management warned of a significant growth slowdown in the third quarter. After the announcement, the stock price slid momentarily, but during August it bounced back making a new all-time high at $380.66
Intuit Inc
Monthly Return: +6.82%
YTD Return: +49.08%
LTM Return: +63.06%
Intuit represents the fourth-largest position in the BI Portfolio with a percentage of 6.5%
At the beginning of the month, Intuit’s stock price was $529.97 and it closed in August with a stock price of $566.11, which represents a +6.82% increase.
During the month, Intuit reported strong full-year results.
Here’s how the company did:
For the fourth quarter, Intuit reported:
Total revenue of $2.56B vs $2.32B expected -> up +41 percent from $1.8 B in the prior year, including the addition of Credit Karma.
Small Business and Self-Employed Group revenue grew by 19% to $1.3 B and Online Ecosystem revenue grew by 30%.
Consumer Group revenue of $852M, compared to $710M in the prior year.
Credit Karma revenue of $405M, a quarterly record for the business.
Adjusted EPS of $1.97 vs. $1.59 expected.
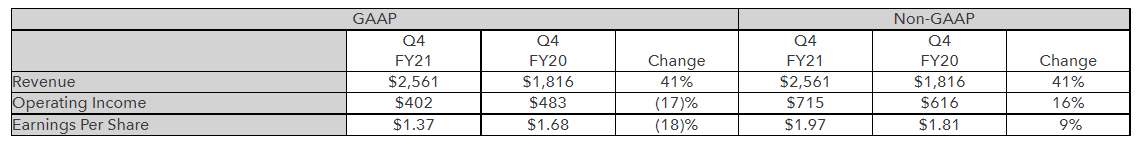
Source: Company reports
For the full year, including the addition of Credit Karma beginning December 3, Intuit reported:
Total revenue of $9.6B, up 25% YoY, including 11 points from the addition of Credit Karma this year.
Combined Platform Revenue, which includes QuickBooks Online, TurboTax Online, and Credit Karma, grew 39% to $6.6B. This includes 18 points from the addition of Credit Karma this year.
Small Business and Self-Employed Group revenue grew 16% and Online Ecosystem revenue grew 26%
Consumer Group revenue grew 14% to $3.6B.
Credit Karma revenue of $865M.
GAAP operating income of $2.5B, up 15%
Non-GAAP operating income of $3.5B, up 31%
GAAP and non-GAAP earnings per share grew by 9% and 24%, respectively.
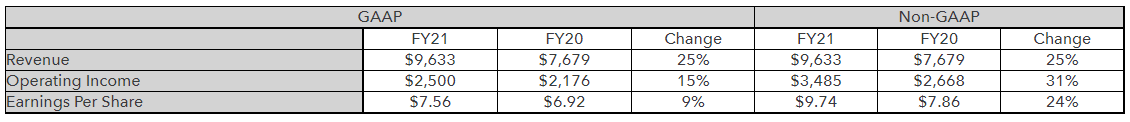
Source: Company reports
"We had a very strong fourth quarter capping off an outstanding fiscal 2021," said Sasan Goodarzi, Intuit's CEO. "Our momentum continues across the company with accelerated innovation focused on our customers' most important needs while creating durable growth opportunities for Intuit in the future."
Also, Intuit announced guidance for the 1Q of 2022, which ends on Oct. 31. The company expects:
Revenue growth of approximately 36% to 38%, including Credit Karma.
GAAP earnings per share of $0.14 to $0.19.
Non-GAAP diluted earnings per share of $0.94 to $0.99.
Intuit also announced guidance for the full fiscal year 2022. The company expects:
Revenue of $11.05B to $11.20B, growth of approximately 15% to 16%, including a full year of Credit Karma.
GAAP operating income of $2.605B to $2.680B, growth of approximately 4% to 7%
Non-GAAP operating income of $4.050B to $4.125B, growth of approximately 16% to 18%
GAAP diluted earnings per share of $7.46 to $7.66.
Non-GAAP diluted earnings per share of $11.05 to $11.25, growth of approximately 13% to 16%
The company expects the following segment revenue results for FY 2022:
Small Business and Self-Employed Group: growth of 12% to 14%
Consumer Group: growth of 10% to 11%
ProConnect Group: growth of 1% to 2%
Credit Karma: revenue of $1.345B to $1.380B.
Finally, Intuit is supposedly in talks to buy mail marketing company Mailchimp for more than $10B. If talks are successful, this would be Intuit's largest-ever deal after the acquisition of Credit Karma last year for ~$7B.
With no official announcement from the company, this could simply be speculation, but this would be an interesting deal for Intuit.
Amazon.com, Inc
Monthly Return: +4.30%
YTD Return: +6.14%
LTM Return: -0.54%
Amazon.com closed the Top 5 ranking of the portfolio with a percentage of 6.1%
At the beginning of the month, Amazon’s stock price was 3,327.59 USD, and it closed in August with a stock price of 3,470.79 USD, which represents a +4.30% increase.
At the end of July, the company reported its Q2 2021 results missing Wall Street expectations -> the stock price slid -3.27%
If you want to know my comments related to Amazon’s Q2 2021 results, you can check them in my last article: Who Will Stop Amazon? Amazon Due Diligence [3/3]
In August the stock price bounced back and recovered part of the drop of July.
Microsoft Corporation
Monthly Return: +5.36%
YTD Return: +35.66%
LTM Return: +32.83%
Microsoft represents a percentage of 6.1% in the BI Portfolio.
At the beginning of the month, the stock price was 286.51 USD, and it closed in August with a stock price of 301.88 USD, which represents a +5.36% increase.
At the end of July, the company reported its Q4 2021 results and beat expectations. During August the stock price continued with the positive momentum following the great performance of the business. For the last 3 months, the stock price is up +20.62%
MTY Food, Inc
Monthly Return: +1.07%
YTD Return: 18.90%
LTM Return: +96.60%
MTY Food represents a percentage of 6.0% in the BI Portfolio.
At the beginning of the month, the stock price was 67.98 CAD, and it closed in August with a stock price of 68.71 CAD, which represents a +1.07% increase.
After reporting outstanding results during July, and with the outlook for the industry clearly improving at least in the U.S and Canada, the stock price increased significantly during July -> +24.57%
During August, the stock price barely move. It seems reasonable after the strong increase it experienced last month.
Constellation Software Inc
Monthly Return: +6.99%
YTD Return: +28.04%
LTM Return: +38.80%
Constellation Software represents a percentage of 5.9% in the BI Portfolio.
At the beginning of the month, Constellation Software’s stock price was 1,998.43 CAD and it closed in August with a stock price of 2,138.19 CAD, which represents a +6.99% increase.
During the month, Constellation Software reported strong 2Q 2021 results.
Here’s how the company did:
Revenue grew 35% (14% organic growth) to $1,249M compared to $922M in Q2 2020.
Net income attributable to common shareholders increased 7% to $88M from $83 in Q2 2020 -> $4.16 vs $3.90 on a diluted per share basis.
A number of acquisitions were completed for aggregate cash consideration of $292M (which includes acquired cash). Deferred payments associated with these acquisitions have an estimated value of $36M resulting in total consideration of $328M.
Cash flows from operations (CFO) was $171M, a decrease of 28%, or $66M, compared to $237M for the comparable period in 2020. The decrease in cash flows was mainly due to negative changes in non-cash operating assets and liabilities exclusive of effects of business combinations, and above-average payments in income taxes. These 2 circumstances are clearly non-recurrent events.
Free cash flow decreased $46M to $145M compared to $190M for the same period in 2020.
The Company determined that certain of its subsidiaries qualified for an estimated aggregate amount of $8M of grants from various government authorities, and recognized such amounts as a reduction to expenses in the quarter.
For holders of the Topicus Coop Preference Units (the “Preferred Securities”) elected to convert their Preferred Securities into Topicus Coop Ordinary Units, the conversion will become effective on February 1, 2022.
Subsequent to June 30, 2021, the Company entered into agreements to acquire a number of businesses for aggregate cash consideration of $122M. Deferred payments associated with these acquisitions have an estimated value of $25M resulting in total consideration of $146M.
Also, the company declared a $1.00 per share dividend payable on October 8, 2021, to all common shareholders.
Overall, the company reported very strong results and the stock price increased following the positive business performance.
Nike, Inc
Monthly Return: -1.65%%
YTD Return: +15.32%
LTM Return: +43.45%
Nike represents a percentage of 5.5% in the BI Portfolio.
At the beginning of the month, Nike’s stock price was $167.51 and it closed in August with a stock price of $164.74, which represents a -1.65% decrease.
It was a quiet month for Nike. During the month, its Board of Directors declared a quarterly cash dividend of $0.275 per share on the company’s outstanding Class A and Class B Common Stock payable on October 1, 2021.
Tencent Holdings Limited
Monthly Return: +0.46%
YTD Return: -16.54%
LTM Return: -12.55%
Tencent Holdings represents a percentage of 5.1% in the BI Portfolio.
At the beginning of the month, Tencent’s stock price was 479 HKD and it closed in August with a stock price of 481.20 HKD, which represents a +0.46% increase.
During the month, Tencent Holdings released its Q2 2021 earnings results giving some comfort to investors. The stock price did not rebound during the month but at least the blood in the streets came to an end. That being said, if tomorrow the CCP releases a new regulation that could harm the company, strong volatility will come back for sure.
That’s nothing new, one of the potential risks of investing in China is the severe regulation that the CCP can impose. Investors willing to invest in Chinese stocks should be aware of all the potential consequences. In China, rules imposed by the CCP can change fast and you may not have time to react accordingly.
What happened during the quarter?
As mentioned by Mr. Ma Huateng, Chairman and CEO of Tencent, “in the quarter, we enhanced our services and achieved healthy growth rates across our business lines, particularly Business Services and advertising, while out game revenue benefitted from international growth.”
Here you have some financial metrics of the 2Q 2021:
Revenue was up +20% QoQ to $21.4B.
Normalized operating profit +14% QoQ to $6.6B
The operating margin decreased to 31% from 33% last year.
Normalized net profit up +13% QoQ to $5.4B
Net margin decreased to 25% from 27% last year.
Adjusted EBITDA up + 15% QoQ to $7.8B
Capex decreased -27% QoQ to $1.07B
Free cash flow decreased -9% QoQ to 2.7B
Total net debt amounted $3.25B
The fair value of its listed companies was $224B -> +13B compared to March 2021
Here you have some operating metrics of the 2Q 2021:
The combined MAU of Weixin and WeChat were 1,251.4M, up 3.8%. It’s the largest communication and social service in China.
Mobile Device MAU of QQ amounted to 509.9M, down -8.8%
Fee-based VAS registered subscriptions amounted to 229.4M, up +12.8%
Regarding regulatory issues with games:
The company mentioned that for some games, the daily game time limit was reduced to 1 hour on non-statutory holidays and to 2 hours on statutory holidays vs regulatory requirements of 1.5 hours and 3 hours respectively.
They prevented in-game spending by players aged under 12.
They cracked down on minors misusing adult accounts, and transactions of adult accounts on third-party platforms.
Also, players aged under 16 accounted for 2.6% whereas players under 12 accounted for only 0.3%
Overall, I think Tencent reported good results during the 2Q 2021. Clearly, the regulatory impact had a negative effect on the company growth rates and profit margins, especially with regard to the segment of Games, but I was expecting worst results. Maybe the panic sell-off during the recent months was a little bit exaggerated!
The Walt Disney Company
Monthly Return: +2.99%
YTD Return: -0.53%
LTM Return: +35.75%
Disney represents a percentage of 5.4% in the BI Portfolio.
At the beginning of the month, Disney’s stock price was $176.02, and it closed in August with a stock price of $181.30, which represents a +2.99% increase.
During the month, Disney reported excellent 3Q 2021 results:
Earnings per share: 80 cents vs 55 cents expected
Revenue: $17.02B vs $16.76B expected
The company beat on subscriber estimates for Disney+, coming in at 116 million. Average monthly revenue per subscriber for Disney+ dipped 10% year over year to $4.16. The company attributed the drop to a higher mix of Disney+ Hotstar subscribers compared with the prior-year quarter.
Disney’s average revenue per user has shrunk in recent quarters because of the lower price points for its Disney+ and Hotstar bundle in Indonesia and India. The service has lower average monthly revenue per paid subscriber than traditional Disney+ in other markets, pulling down the overall average for the quarter.
Overall, the company said it had nearly 174M subscriptions across Disney+, ESPN+, and Hulu at the end of its third quarter. Revenue for its direct-to-consumer segments increased 57% to $4.3B. Average monthly revenue per paid subscriber grew slightly for ESPN+ and Hulu.
Also, Disney said the company’s total addressable market is 1.1 billion households across the globe.
“We’ve only just begun our journey and as I think you see what’s really going to make the difference for Disney is our spectacular content, told by the best storytellers, against our powerhouse franchises,” Chapek said.
Another great news for Disney is that the Parks segment returned to profitability for the first time since the pandemic began.
Revenue in the segment jumped 308% to $4.3B, as all of its parks were reopened during the fiscal third quarter, and attendance and consumer spending rose. Operating income reached $356M, compared with a loss of $1.87B during the same quarter last year.
“We see strong demand for our parks continuing,” Chapek said on the call.
The resurrection of the theme park industry is critical to Disney’s bottom line. In 2019, the segment, which includes cruises and hotels, accounted for 37% of the company’s $69.6B in total revenue.
The results were very good and I’m confident that we can expect to see better results for Q4 2021.
Nagarro SE
Monthly Return: +18.29%
YTD Return: +67.03%
LTM Return: +85.37%
Nagarro represents a percentage of 5.2% in the BI Portfolio.
Nagarro is escalating positions very fast. At the beginning of the month, its stock price was 128.50€, and it closed in August with a stock price of 152€, which represents a +18.29% increase.
During the month, Nagarro reported good results for the 2Q 2021. Demand continued to be strong for Nagarro's services, while supply was significantly constrained by hiring challenges and Covid-19 disruptions.
“Nagarro’s revenue growth continued, despite an overheated job market and the afflictions of the second wave of Covid-19 in India”, said Manas Fuloria, co-founder. “We again added over 1000 professionals in this quarter, including fresh graduates, net of attrition. The company retains its revenue and Adjusted EBITDA guidance for 2021. However, we are reducing our gross margin guidance from 32% to 29% because of unprecedented wage inflation, while the effect of our remedial steps will lag the increase in wages. We have other operational levers to still feel comfortable about our Adjusted EBITDA guidance for 2021.”
Here you have the key financial highlights for the quarter:
Revenue grew to €127.3M in Q2 2021, up 21.1% YoY from €105.1M in Q2 2020, and up 10.0% QoQ from €115.7M in Q1 2021.
Gross profit increased to €38.0M in Q2 2021 from €36.0M in Q2 2020. The gross margin dropped to 29.9% in Q2 2021 from 34.2% in Q2 2020.
Adjusted EBITDA decreased by 9.8% YoY to €19.0M (14.9% of revenue) in Q2 2021, from €21.0M (20.0% of revenue) in Q2 2020. It should be noted here that Q2 2020 results had included the effect of temporary salary cuts in response to the pandemic.
The cash balance amounted to €101.9 million.
Starbucks Corporation
Monthly Return: -3.24%
YTD Return: +9.13
LTM Return: +36.54%
Starbucks represents a percentage of 5.2% in the BI Portfolio.
At the beginning of the month, Starbucks’ stock price was $121.43, and it closed the month of July with a stock price of $117.49, which represents a -3.24% decrease.
During the month, Starbucks partnered with Ocean Conservancy to welcome reusables back in stores.
“Starbucks is pleased to bring back personal reusable cups to help reduce single-use cup waste and to support those customers who bring in their own cups by contributing to the pioneering work of Ocean Conservancy,” said Michael Kobori, Starbucks chief sustainability officer.
Booking Holdings Inc
Monthly Return: +5.57%
YTD Return: +2.21%
LTM Return: +19.22%
Booking represents a percentage of 4.0% in the BI Portfolio.
At the beginning of the month, its stock price was $2,178.26, and it closed in August with a stock price of $2,299.67, which represents a +5.57% increase.
During the month, the company announced that the results for the 3 and 6 months ended June 30, 2021, and 2020 have been significantly and negatively impacted due to the COVID-19 pandemic and the resulting economic conditions and government restrictions.
Here’s how the company did during the 2Q of 2021:
2Q gross travel bookings of all travel services booked by its customers, net of cancellations, were $22.0B, an increase of 852% QoQ
Room nights booked in the 2nd quarter increased 458% QoQ
Total revenues for the 2Q of 2021 were $2.2B, a 243% increase QoQ
The Company reported a net loss of $167M in the 2Q of 2021, compared with a net income of $122M in the 2Q of 2020. The results for the 2Q of 2021 and 2020 include net gains of $391M and $835M, respectively, on equity securities with readily determinable fair values.
Additionally, in the 2Q of 2021, the company recorded a loss on early extinguishment of debt of $242M.
In June 2021, the company announced its intention to voluntarily return assistance received through various government aid programs and recorded expenses of $137M in the 2Q of 2021 to reflect the return of such assistance.
Little by little, the business is improving its financial and operating metrics. Although management was probably expecting a faster recovery, travel demand is certainly improving, and eventually, it will return to its pre-pandemic levels.
Berkshire Hathaway Inc
Monthly Return: +2.69%
YTD Return: +23.32%
LTM Return: +30.76%
Berkshire Hathaway represents a percentage of 4.0% in the BI Portfolio.
At the beginning of the month, Berkshire Hathaway Class B stock price was $278.29, and it closed in August with a stock price of $285.77, which represents a +2.69% increase.
During the month, Berkshire Hathaway reported its 2Q 2021 results:
The company reported operating earnings of $6.69B in the 2Q, up 21% from $5.51B in the same period a year ago.
Overall earnings, which reflect Berkshire’s fluctuating equity investments, increased 6.8% YoY to $28B in the 2Q.
Warren Buffett kept buying back Berkshire shares aggressively. The company repurchased $6B of its own stock in the 2Q, bringing the six-month total to $12.6B. Berkshire bought a record $24.7B of its own stock last year.
At the end of June, Berkshire’s cash pile stood at $144.1B, holding steady from last quarter’s level and still near a record despite the company’s massive buyback program.
As economic activity continues to grind back to life from the pandemic with more commodities and goods being shipped around the country, Berkshire’s Burlington Northern Santa Fe railroad stands to benefit. Earnings for railroads, utilities, and energy jumped more than 27% from a year ago in the period to $2.26B, Berkshire said. The conglomerate’s other businesses, including homebuilders and a paint-maker, are also seeing a boost.
Though Berkshire acknowledged the quarterly results look stellar because they are bouncing back from a low base a year ago and the company is unsure of when results will truly return to normal.
“The COVID-19 pandemic adversely affected nearly all of our operations during 2020 and in particular during the second quarter, although the effects varied significantly,” Berkshire said in the earnings report Saturday. “The extent of the effects over longer terms cannot be reasonably estimated at this time.”
Berkshire said the risks from the pandemic still remain and could impact its results in the future.
“Risks and uncertainties resulting from the pandemic that may affect our future earnings, cash flows and financial condition include the ability to vaccinate a significant number of people in the U.S. and throughout the world as well as the long-term effect from the pandemic on the demand for certain of our products and services,” the conglomerate said.
Topicus.com, Inc
Monthly Return: +42.18%
YTD Return: +93.98%
LTM Return: +93.98
Topicus.com represents a percentage of 0.6% in the BI Portfolio. The company is a Spin-Off from its parent company Constellation Software, which still controls Topicus.com since it has more than 50% of the voting power.
During the Spin-Off at the beginning of the year, all of Constellation’s common shareholders of record on December 28, 2020, received a dividend-in-kind, 1.859817814 subordinate votings shares of Topicus.com for each common share of Constellation held.
Basically, I received Topius.com shares for free.
At the beginning of the month, its stock price was 90.05 CAD and it closed in August with a stock price of 128.03 CAD, which represents a +42.18% increase.
During the month, Topicus announced outstanding 2Q 2021 results:
Revenue increased 54% (8% organic growth) to €178.2M compared to €115.6M in Q2 2020.
A €154.6M non-cash gain related to the decrease in fair value of redeemable preferred securities was incurred in the quarter. The fair value of the preferred securities was primarily dependent on the price movement of Topicus’ Subordinate Voting Shares.
Net income increased to €168.8M (€0.11 on a diluted per share basis) from €14.1M (€0.12 on a diluted per share basis) in Q2 2020 primarily resulting from the €154.6M redeemable preferred securities gain.
A number of acquisitions were completed for aggregate cash consideration of €5.2M (which includes acquired cash). Deferred payments associated with these acquisitions have an estimated value of €1.1M resulting in total consideration of €6.4M.
Cash flows from operations (CFO) decreased €26.3M to negative €34.6M compared to negative €8.3M in Q2 2020. The same has happened with Constellation Software, the decrease in cash flows was mainly due to negative changes in non-cash operating assets and liabilities exclusive of effects of business combinations, and extraordinary non-recurrent payments in income taxes.
Free cash flow available to shareholders decreased €17.0M to negative €25.4M compared to negative €8.5M in Q2 2020.
For holders of the Topicus Coop Preference Units (the “Preferred Securities”) elected to convert their Preferred Securities into Topicus Coop Ordinary Units, the conversion will become effective on February 1, 2022.
Subsequent to June 30, 2021, the company completed or entered into agreements to acquire a number of businesses for aggregate cash consideration of €49.6M. Deferred payments associated with these acquisitions have an estimated value of €6.7M resulting in total consideration of €56.3M.
If you have any ideas related to the information you’d like to see each week, or perhaps where you feel it could improve, please reply to this email, or drop me a DM on Twitter @buddhist_invest
Thank you for your support, and all the best in your journey to become a successful investor.
Yours truly,
The Buddhist Investor
👉New to the newsletter? Make sure you subscribe here:
👉Help me grow this amazing community: if you enjoyed this post, make sure to share it with anyone who could benefit from it.
👉If you REALLY enjoyed this article, feel free to buy me a cup of tea — donations are never needed but are always appreciated! :)
Disclosure:
This information reflects my personal opinion and is merely informative. Therefore it should not serve as a basis for an investment recommendation. Investors must perform a previous due diligence analysis before making investment decisions and be responsible for their actions.
The S&P 500 monthly returns don’t include dividends.