

The Buddhist Investor Portfolio - July 2021
The Buddhist Investor Portfolio - July 2021

Dear investor,
Welcome to The Buddhist Investor Portfolio. In this post, I’m going to review the performance of the portfolio during July.
My goal is to provide complete access to my portfolio decision-making. I will post monthly updates on current portfolio holdings and updates that detail each position, its weight, and returns in the portfolio.
Also, I will give my comments on any events that occurred during the month that affected the stock price of the businesses we own in the portfolio.
Let’s get started with it!
Market Overview
The month of July was a great month for the financial markets. The S&P 500 increased +2.28% during the month, following the positive trend of June. As of date 07/31/2021, the S&P 500 YTD return (without including dividends) is +16%
Here you have the monthly returns of 2021:
July 31, 2021: +2.28%
June 30, 2021: +2.22%
May 31, 2021: +0.55%
April 30, 2021: +5.24%
March 31, 2021: +4.24%
February 28, 2021: +2.61%
January 31, 2021: -1.11%
During July, the global economic recovery continued with the vaccine rollout making steady progress and restrictions on activity being eased further in several major developed markets.
However, the positive sentiment was dented by the spread of the more contagious Delta variant of Covid-19, raising concerns that the path to normality may be bumpier than previously expected.
You can see below, the world stock market returns:
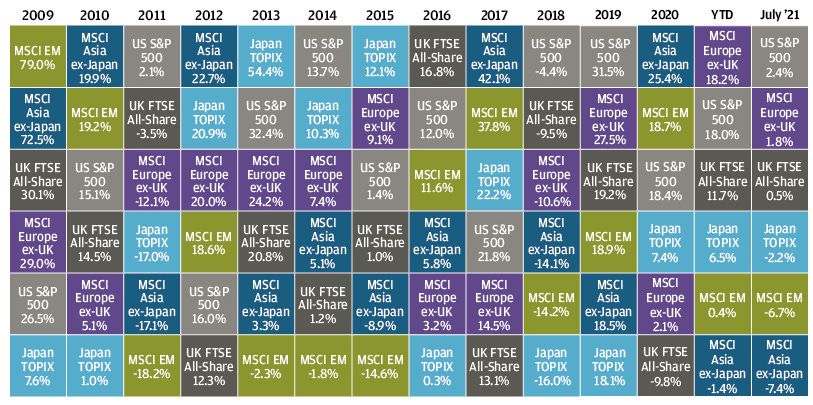
Source: JP Morgan Asset Management
The Overall Picture
Here is the information related to The Buddhist Investor (BI) Portfolio in € as of July 31, 2021:
Monthly Return: +4.61%
YTD Return: +26.06%
LTM Return: +51.88%
The composition of the BI Portfolio at the end of July is as follows:
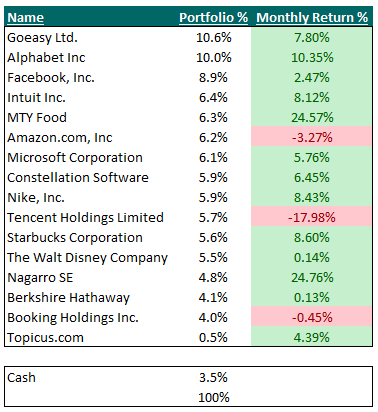
At the end of July, the TOP 5 positions in the portfolio were:
Goeasy Ltd (10.6%): +7.80%
Alphabet, Inc (10.0%): +10.35%
Facebook, Inc (8.9%): +2.47%
Intuit Inc (6.4%): +8.12%
MTY Food (6.3%): 24.57%
Overall, my TOP 5 positions account for 42% of the BI Portfolio.
In comparison with the last month, Intuit and MTY Food made it inside of the TOP 5 whereas Tencent Holdings and Amazon stayed below and couldn’t make it.
As you can see, I let the portfolio concentrated on itself. The businesses I own, need to earn their higher allocation in my portfolio. I like that because my portfolio is being concentrated for me in the biggest winners and the biggest losers become less relevant.
The best performers of the month were Nagarro SE -> +24.76% and MTY Food -> + 24.57%
The worst performers of the month were Tencent Holdings Limited -> -17.98% and Amazon.com -> -3.27%
Also, I keep 3.5% of cash to have optionality in case future opportunities arise.
Goeasy Ltd
Monthly Return: +7.80%
YTD Return: +76.93%
LTM Return: +204.32%
Goeasy represents the main position in the BI Portfolio with a percentage of 10.6%.
At the beginning of the month, Goeasy’s stock price was 158.63 CAD and it closed the month of July with a stock price of 171 CAD, which represents a +7.80% increase.
During July, the stock price followed the good momentum of the business after the company reported record results in May.
Also, the company announced the appointment of Jackie Foo as Executive Vice-President and Chief Operating Officer.
Alphabet Inc
Monthly Return: +10.35%
YTD Return: +53.74%
LTM Return: +81.09%
Alphabet represents the second-largest position in the BI Portfolio with a percentage of 10.0%
At the beginning of the month, Alphabet’s stock price was 2,441.79 USD and it closed the month of July with a stock price of 2,694.53 USD, which represents a +10.35% increase.
At the end of the month, the company reported its FY21 Q2 results and crushed analysts’ estimates.
Here are the results.
Earnings per share (EPS): $27.26 vs $19.34 per share expected.
Revenue: $61.88 billion vs $56.16 billion expected.
YouTube advertising revenue: $7.00 billion vs $6.37 billion expected.
Google Cloud revenue: $4.63 billion vs $4.40 billion expected.
Traffic acquisition costs (TAC): $10.93 billion vs $9.74 billion expected.
Total Google ad revenue increased to $50.44 billion, up 69% from the year-ago quarter, which was hurt by the onset of the Covid pandemic.
YouTube revenue came in over $7 billion, up 83% from last year, drawing close to Netflix’s quarterly revenue, which was $7.34 billion.
Google Cloud brought in $4.63 billion — up from $3.01 billion a year ago.
The cloud business had operating losses of $591 million, a dramatic improvement from last year’s loss of $1.43 billion.
Schindler said connected TV is “the fastest growing consumer surface that we have,” stating how the company has over 120 million people who watch YouTube on their TVs every month.
Also, Alphabet CFO Ruth Porat said she expects a “more muted tailwind to revenues in the third quarter.” She said it’s too early to forecast the longer term trends as markets re-open, especially given Covid case rates growing.
Facebook, Inc.
Monthly Return: +2.47%
YTD Return: +30.44%
LTM Return: +40.46%
Facebook represents the third-largest position in the BI Portfolio with a percentage of 8.9%
At the beginning of the month, Facebook’s stock price was 347.71 USD and it closed the month of July with a stock price of 356.30 USD, which represents a +2.47% increase.
At the end of the month, the company reported its FY21 Q2 results and beat expectations. However, management warned of a significant growth slowdown in the third quarter.
Here’s how the company did:
Earnings: $3.61per share, adjusted, vs. $3.03 per share expected.
Revenue: $29.08 billion, vs. $27.89 billion expected.
Daily active users (DAUs): 1.91 billion, vs. 1.91 billion expected.
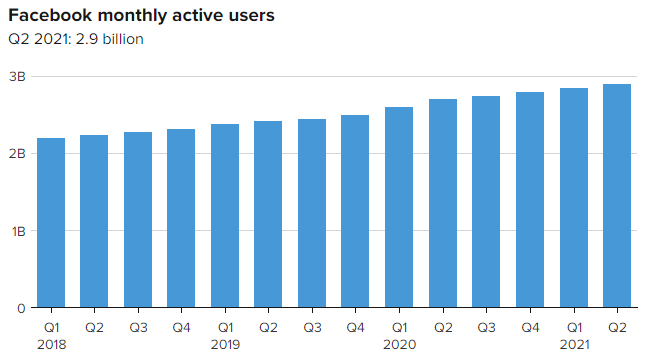
Monthly active users (MAUs): 2.90 billion, vs. 2.91 billion expected.
Average revenue per user (ARPU): $10.12, vs. $9.66 expected.
Facebook’s revenue grew by 56% year over year in the second quarter. It’s the fastest growth since 2016, accelerating from a 48% increase in the prior quarter. The company pointed to a 47% rise in average price per ad, along with a 6% increase in the number of ads it delivered.
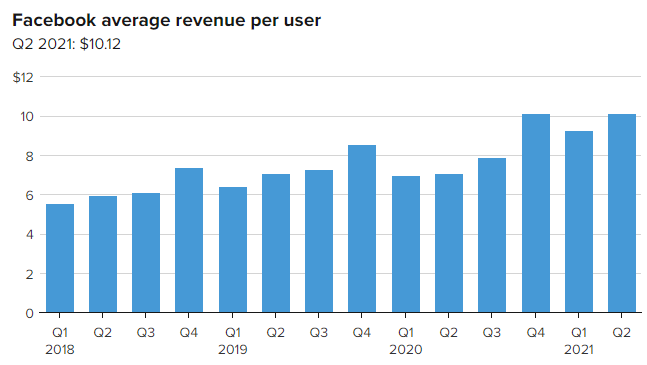
Source: Company statements
Revenue from Facebook’s Other segment, including consumer hardware such as Oculus virtual reality headsets, totaled $497 million, up 36%
Facebook said in the second quarter it had 3.51 billion monthly users across its family of apps, up from 3.45 billion in the first quarter. This metric is used to measure Facebook’s total user base across its main app, Instagram, Messenger, and WhatsApp.
In the U.S. and Canada, where Facebook generates more ARPU than in other regions, the company reported 195 million DAUs, the same as in the first quarter. In Europe, the count declined sequentially to 307 million from 309 million in the first quarter.
With respect to guidance for the second half of the year, Facebook said it expects “year-over-year total revenue growth rates to decelerate significantly on a sequential basis as we lap periods of increasingly strong growth.” That’s effectively unchanged from Facebook’s guidance three months earlier.
Also, CEO Mark Zuckerberg talked about the company’s goal to help develop the metaverse, which he described as “a virtual environment where you can be present with people in digital spaces.”
“In the coming years, I expect people will transition from seeing us primarily as a social-media company to seeing us as a metaverse company,” Zuckerberg said. Advertising will probably be a meaningful part of the metaverse, and Facebook’s goal won’t be to sell devices at a high premium, he said.
Zuckerberg’s vision for the metaverse requires a sense of presence in a virtual world, which is why the company is investing heavily in its Oculus division to build the necessary hardware. Zuckerberg said he thinks Facebook will also be able to make money from the metaverse through the sale of digital goods and experiences.
In addition, David Wehner, Facebook’s CFO said the company expects a larger impact from iOS 14.5 in the third quarter than in the second quarter. “We’re not fully rolled out with those changes, but Q3 will have the impact more or less of those meaningfully rolled out,” he said.
Intuit Inc
Monthly Return: +8.12%
YTD Return: +39.52%
LTM Return: +72.98%
Intuit represents the fourth-largest position in the BI Portfolio with a percentage of 6.4%
At the beginning of the month, Intuit’s stock price was $490.17 and it closed the month of July with a stock price of $529.97, which represents a +8.12% increase.
During July, the stock price followed the good momentum of the business after the company reported great results in May.
Also, the company introduced QuickBooks Card Reader, a new innovative payments device designed for small business owners. Integrated with QuickBooks Payments, which processes more than $65 billion in volume annually, the card reader helps small businesses get paid faster, no matter how or where they work.
MTY Food, Inc
Monthly Return: +24.57%
YTD Return: 17.31%
LTM Return: +135.22%
MTY Food closes the Top 5 of the BI Portfolio with a percentage of 6.3% in the BI Portfolio.
At the beginning of the month, the stock price was 54.57 CAD, and it closed the month of July with a stock price of 67.98 CAD, which represents a +24.57% increase.
MTY Food reported its FY21 2Q results at the beginning of the month.
Here’s how the company did:
System sales of $891.5 million, up 33% compared to FY20 Q2. System sales up 56% in Canada, 24% in the US, and 38% Internationally.
Second-quarter digital sales represented 27% and 22% of total system sales for Canada and the US, respectively.
Adjusted EBITDA of $43.5 million in the quarter, compared to $18.2 million in FY20 Q2.
Cash flows from operating activities of $29.5 million, up by 54% compared to FY20 Q2.
Free cash flows per diluted share decreased by 5% compared to FY20 Q2 to reach $1.11. FY20 Q2 was favorably impacted by the proceeds received from franchising multiple corporate locations.
Net income attributable to shareholders of $23.0 million in the quarter, or $0.93 per share, up from a net loss attributable to shareholders of $99.1 million, or $4.01 per share, in FY20 Q2.
Long-term debt repayments of $15.2 million for the quarter.
Quarterly dividend restored with payment of $0.185 per share on August 13, 2021, and NCIB renewed until July 2022.
Also, 321 restaurants were temporarily closed at the beginning of the quarter and 359 at the end of the quarter, and 977 locations were closed one or more days during the quarter, representing approximately 38,300 lost business days.
Overall, the company presented outstanding results, and seems the outlook for the industry is clearly improving at least in the U.S and Canada.
Amazon.com, Inc
Monthly Return: -3.27%
YTD Return: +2.17%
LTM Return: +5.15%
Amazon.com represents a percentage of 6.2% in the BI Portfolio.
At the beginning of the month, Amazon’s stock price was 3.440.16 USD, and it closed the month of July with a stock price of 3.327.59 USD, which represents a -3.27% decrease.
At the end of the month, the company reported its FY21 Q2 results and missed Wall Street expectations.
Here’s how the company did:
Earnings: $15.12 vs $12.30 per share expected.
Revenue: $113.08 billion vs $115.2 billion expected.
If you want to know my comments related to Amazon’s FY21 Q2 results, you can check them in my last article: Who Will Stop Amazon? Amazon Due Diligence [3/3]
Microsoft Corporation
Monthly Return: +5.76%
YTD Return: +28.10%
LTM Return: +38.97%
Microsoft represents a percentage of 6.1% in the BI Portfolio.
At the beginning of the month, the stock price was 270.90 USD, and it closed the month of July with a stock price of 286.51 USD, which represents a +5.76% increase.
At the end of the month, the company reported its FY21 Q4 results and beat expectations.
Here’s how the company did:
Earnings: $2.17 per share, adjusted, vs. $1.92 per share expected.
Revenue: $46.15 billion, vs. $44.24 billion expected.
Revenue rose 21% year over year in the quarter, and net income increased by 47%
In the fiscal fourth quarter, Microsoft’s Intelligent Cloud segment, which includes the Azure public cloud, Windows Server, SQL Server, and GitHub, produced $17.38 billion in revenue, up 30% year over year.
Revenue from Azure, which competes with Amazon Web Services (AWS), grew 51% in the quarter, or 45% in constant currency.
“In the fiscal first quarter, Azure revenue growth in constant currency should remain relatively stable on a sequential basis”, Microsoft’s CFO Amy Hood said on the company’s earnings call.
The Productivity and Business Processes unit, which contains Office productivity software along with LinkedIn and Dynamics, contributed $14.69 billion in revenue, up 25%
Here you can see a detail of Microsoft products and services growth since the first quarter of 2020:
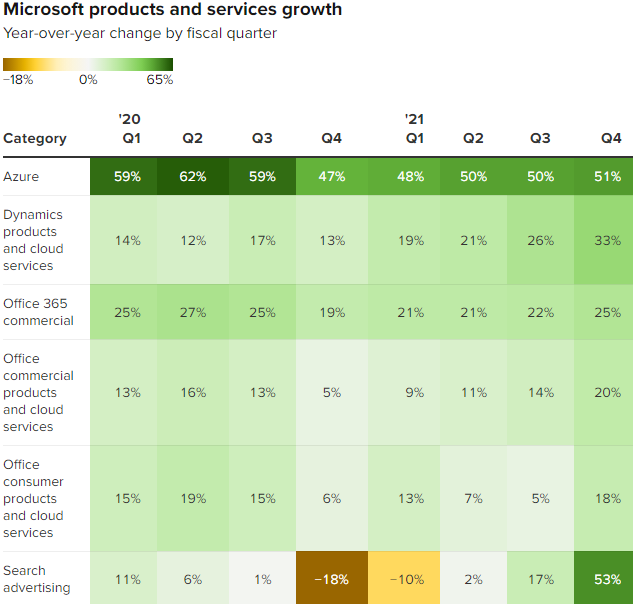
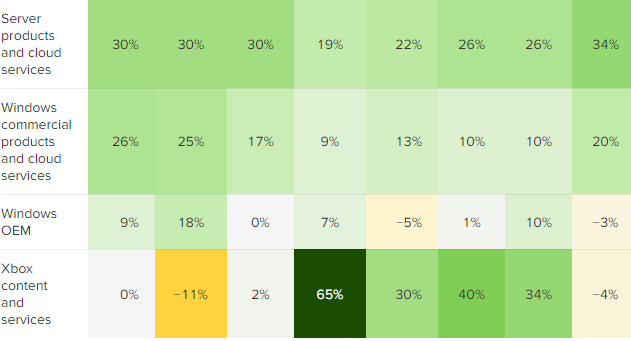
Source: Company reports
In addition, during the fiscal fourth quarter, Microsoft announced its intent to acquire speech-recognition company Nuance Communications for $19 billion, including debt. It also introduced Windows 11, a new version of its desktop operating system, although sales of licenses to device makers will be deferred.
With respect to guidance, Microsoft called for $14.5 billion to 14.75 billion in fiscal first-quarter revenue from its Productivity and Business Processes segment. For the Intelligent Cloud segment, the company sees $16.4 billion to $16.65 billion in revenue, and for the More Personal Computing segment guidance was $12.4 billion to $12.8 billion in revenue.
Constellation Software Inc
Monthly Return: +6.45%
YTD Return: +20.90%
LTM Return: +26.13%
Constellation Software represents a percentage of 5.9% in the BI Portfolio.
At the beginning of the month, Constellation Software’s stock price was 1,877.41 CAD and it closed the month of July with a stock price of 1,998.43 CAD, which represents a +6.45% increase.
Nike, Inc
Monthly Return: +8.43%
YTD Return: +18.41%
LTM Return: +71.61%
Nike represents a percentage of 5.7% in the BI Portfolio.
At the beginning of the month, Nike’s stock price was $154.49 and it closed the month of July with a stock price of $167.51, which represents a +8.43% increase.
During July, the stock price followed the good momentum of the business after the company reported great figures for its FY21 4Q and full-year results.
Tencent Holdings Limited
Monthly Return: -17.98%
YTD Return: -15.07%
LTM Return: -10.30%
Tencent Holdings represents the fourth-largest position in the BI Portfolio with a percentage of 5.7%
At the beginning of the month, Tencent’s stock price was 584 HKD and it closed the month of July with a stock price of 479 HKD, which represents a -17.98% decrease.
The Chinese government is tightening its control over Chinese technology companies. On the surface, China’s “tech crackdown” is exactly that: a clash between government power — wielded by the Chinese Communist Party (CCP) — and the “tech sector.”
Here you can see the different stages of the Chinese crackdown until July 2021:
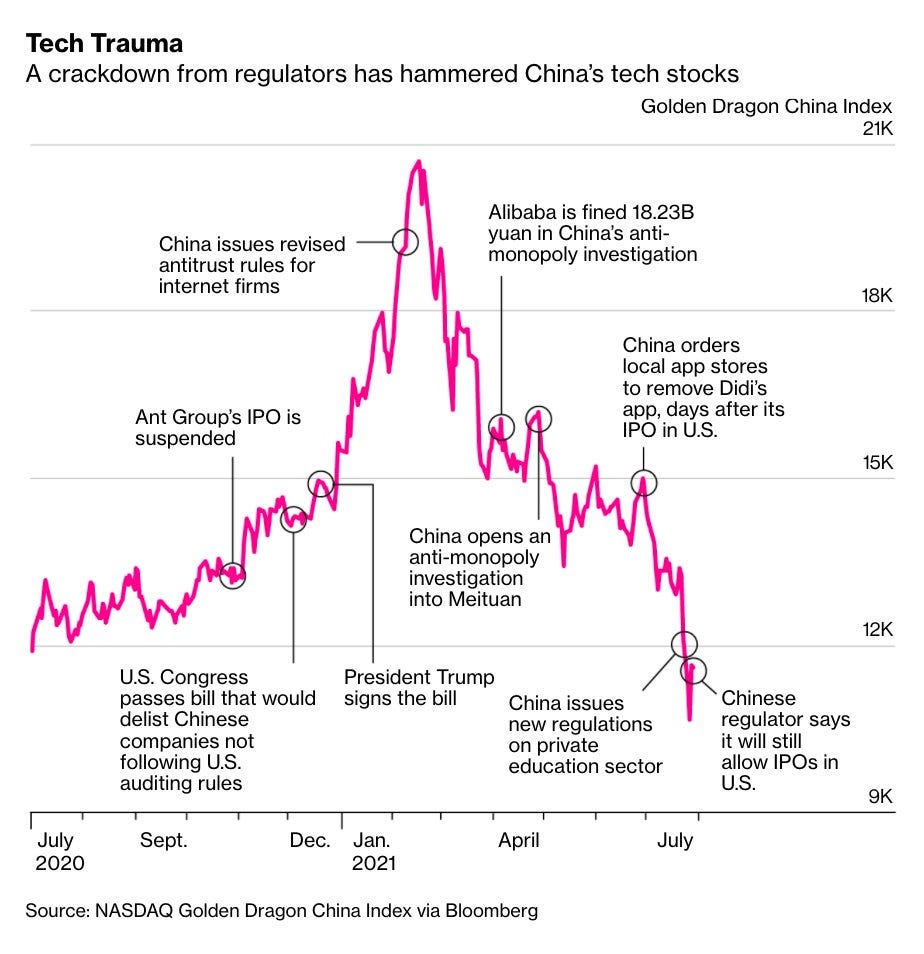
Since China announced antitrust and regulatory measures, Tencent’s stock price has dropped close to 40% from its last peak of 757 HKD back in February. Antitrust laws and other regulations, such as online gaming restrictions, are putting pressure on business profitability.
As you can imagine, one of the potential risks of investing in China is the severe regulation that the CCP can impose. Investors willing to invest in Chinese stocks should be aware of all the potential consequences. In China, rules imposed by the CCP can change fast and you may not have time to react accordingly.
However, I don’t think it’s time to cash out the investment since perspectives for the business still look great, even considering the antitrust measures imposed.
Its current valuation looks incredibly attractive. As of August 8th, Tencent Holdings is trading at 20 times forward FCF, when historically its average FCF multiple has been around 27-29 times.
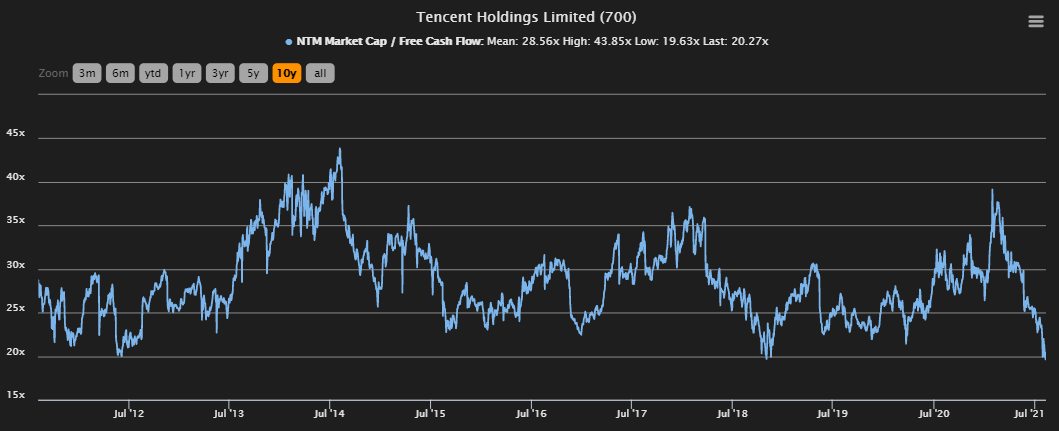
Source: TIKR.com
As you can see in the chart, the stock is trading close to the lowest valuation multiple of the last 10 years.
Let’s consider now 3 future possible scenarios in the next 5 years, assuming we buy Tencent’s stock at its current price of 453.60 HKD as of 08/08/2021.
Best case scenario: Tencent’s free cash flow grows at a CAGR of 15% and the stock trades at 25 times FCF. This situation would imply a target price of 1,125 HKD in 5 years with an internal rate of return (IRR) of 20% or 2.5 times your initial investment.
Base case scenario: Tencent’s free cash flow grows at a CAGR of 12% and the stock trades at 23 times FCF. This situation would imply a target price of 907 HKD in 5 years with an internal rate of return (IRR) of 15% or 2.0 times your initial investment.
Worst case scenario: Tencent’s free cash flow grows at a CAGR of 10% and the stock valuation stays at 20 times FCF. This situation would imply a target price of 721 HKD in 5 years with an internal rate of return (IRR) of 10% or 1.6 times your initial investment.
The margin of safety seems very wide. Even in the worst-case scenario, we could potentially achieve a return equal to the historical average of the S&P 500 -> 10%
In my opinion, a high-quality business such as Tencent, which has an attractive valuation and with minimum growing expectations of 10% for the coming years, doesn’t seem like a business to sell right now.
Starbucks Corporation
Monthly Return: +8.60%
YTD Return: +13.51%
LTM Return: +58.67%
Starbucks represents a percentage of 5.6% in the BI Portfolio.
At the beginning of the month, Starbucks’ stock price was $111.81, and it closed the month of July with a stock price of $121.43, which represents a +8.60% increase.
Starbucks topped Wall Street’s estimates for its FY21 3Q earnings and revenue.
Here’s what the company reported:
Earnings per share: $1.01 adjusted vs. 78 cents expected.
Revenue: $7.5 billion vs. $7.29 billion expected.
The coffee giant reported FY21 3Q net income of $1.15 billion, or 97 cents per share, up from a net loss of $678.4 million, or 58 cents per share a year earlier.
Net sales rose 78% to $7.5 billion. Worldwide, same-store sales surged 73%. A year ago, the company’s global same-store sales plummeted 40% during the quarter as the global pandemic prompted in lockdowns in some regions.
In the U.S., Starbucks’ largest market, same-store sales climbed 83%. On a two-year basis, the market’s same-store sales rose 10%. Nearly three-quarters of the company’s drink sales came from cold beverages, like its Nitro cold brew. Over half of all sales came from loyalty program members.
Outside of the U.S., Starbucks’ same-store sales jumped 41%, fueled by a 55% growth in customer traffic.
“It’s important to remember that the vast majority of international markets in which we operate are behind the U.S. in terms of both vaccination and mobility, so revenue recovery is predictably lagging in these markets,” CFO Rachel Ruggeri said.
China reported same-store sales growth of 19%. A year ago, the country’s same-store sales fell 19%
“The health of our business in China is strong and we’ve never been more confident in the long-term growth opportunity,” CEO Kevin Johnson told analysts.
For fiscal 2021, the company raised its earnings per share outlook to a range of $2.97 to $3.02, up from its prior range of $2.65 to $2.75. On an adjusted basis, it’s expecting earnings per share of $3.20 to $3.25, up from the prior range of $2.90 to $3.
Starbucks also narrowed its outlook for global same-store sales growth for the full year. It now expects that metric to rise 20% to 21%, compared with a prior range of 18% to 23%
The company also predicted slowing same-store sales in China, where it previously predicted growth of 27% to 32%. Now, however, it’s forecasting same-store sales growth of 18% to 20%. Next quarter, it expects flat same-store sales for the country.
“Our previous comp guidance has assumed a shorter timeframe for the lifting of travel restrictions and also less of the uncertainties that we have faced in the market, and, hence, we are adjusting our comp guidance to reflect the uncertainties,” said Belinda Wong, CEO of Starbucks China.
In the U.S, Starbucks now expects sales growth of 21% to 22% for cafes open at least 13 months, on the higher end of its prior range of 17% to 22%.
Johnson also said that Starbucks has locked in the price of its coffee beans for the next 14 months, protecting it against the impact of higher prices related to colder temperatures in Brazil.
However, the company is expecting to see rising inflation next quarter and in fiscal 2022 in other areas, like labor. Ruggeri, Starbuck’s CFO said that the company has flexibility with pricing and can push customers to buy more cold drinks, which tend to be more expensive, or encouraging customization, like adding an espresso shot.
The Walt Disney Company
Monthly Return: +0.14%
YTD Return: -2.85%
LTM Return: +50.52%
Disney represents a percentage of 5.5% in the BI Portfolio.
At the beginning of the month, Disney’s stock price was 175.77 USD, and it closed the month of July with a stock price of 176.02 USD, which represents a +0.14% increase.
Nagarro SE
Monthly Return: +24.76%
YTD Return: +41.21%
LTM Return: +55.60%
Nagarro represents a percentage of 4.8% in the BI Portfolio.
At the beginning of the month, its stock price was 103€, and it closed the month of July with a stock price of 128.50€, which represents a +24.76% increase.
During the month, Nagarro and start-up airline Flyr (a new Norwegian airline) reached a key milestone in creating the first digital airline. Flyr teamed up with Nagarro to create a digital product that offers passengers a flexible, hassle-free booking and travel experience. Keeping to a strict time-to-market timeline and spanning delivery over five countries and eight virtual organizations, Nagarro helped Flyr go from conceptualization to flight operations.
The achievement is marked by the start of Flyr’s flight operations, which began on June 30, 2021, less than half a year after Nagarro started the technical implementation and integration of Flyr’s core IT systems.
During July, the stock price followed the good momentum of the business and increased significantly -> +24.76%
Nagarro is one of the positions in the BI Portfolio with the highest upside.
Berkshire Hathaway Inc
Monthly Return: +0.13%
YTD Return: +20.02%
LTM Return: +42.14%
Berkshire Hathaway represents a percentage of 4.1% in the BI Portfolio.
At the beginning of the month, Berkshire Hathaway Class B stock price was $277.92, and it closed the month of July with a stock price of $278.29, which represents a +0.13% increase.
Booking Holdings Inc
Monthly Return: -0.45%
YTD Return: -2.20%
LTM Return: +31.05%
Booking represents a percentage of 4.0% in the BI Portfolio.
At the beginning of the month, its stock price was $2,188.09, and it closed the month of June with a stock price of $2,178.26, which represents a -0.45% decrease.
Topicus.com, Inc
Monthly Return: +4.39%
YTD Return: +49.80%
LTM Return: +49.80%
Topicus.com represents a percentage of 0.5% in the BI Portfolio. This percentage is almost residual. The company is a Spin-Off from its parent company Constellation Software, which still controls Topicus.com since it has more than 50% of the voting power.
During the Spin-Off at the beginning of the year, all of Constellation’s common shareholders of record on December 28, 2020, received a dividend-in-kind, 1.859817814 subordinate votings shares of Topicus.com for each common share of Constellation held.
Basically, I received Topius.com shares for free.
At the beginning of the month, its stock price was 90.05 CAD and it closed the month of June with a stock price of 94 CAD, which represents a +4.39% increase.
👉New to the newsletter? Make sure you subscribe here:
👉Help me grow this amazing community: if you enjoyed this post, make sure to share it with anyone who could benefit from it.
If you have any ideas related to the information you’d like to see each week, or perhaps where you feel it could improve, please reply to this email, or drop me a DM on Twitter @buddhist_invest
Thank you for your support, and all the best in your journey to become a successful investor.
Yours truly,
The Buddhist Investor
Disclosure: This information reflects my personal opinion and is merely informative. Therefore it should not serve as a basis for an investment recommendation. Investors must perform a previous due diligence analysis before making investment decisions and be responsible for their actions.