

8 Cash Flow Ratios Every Investor Must Know
8 Cash Flow Ratios Every Investor Must Know

“In an era where our attention is monetized, focus is a superpower.”
—The Buddhist Investor
Dear investor,
The numbers in a company's financial statements reflect the company's business, products, services, and macro-fundamental events. You have to understand accounting and you have to understand the nuances of accounting. It's the language of business and it's an imperfect language, but unless you are willing to put in the effort to learn accounting and interpret financial statements, you really shouldn't select stocks yourself.
Investors should look for consistency in a company’s financial statements. Consistency in high gross profit margins, little debt, massive earnings, growing cash flows, etc. The general purpose of the financial statements is to inform you of all of these lesser-known facts for free.
Also through the financial statements, you can find potential red flags or warnings indicators that may suggest that there is a potential problem or threat with the business operations.
Before you start crunching numbers, it's critical to develop an understanding of what the company does, its products and/or services, and the industry in which it operates.
Knowing how to work with the numbers in a company's financial statements is an essential skill for stock investors. The meaningful interpretation and analysis of balance sheets, income statements, and cash flow statements to discern a company's investment qualities is the basis for smart investment choices.
The most common sets of financial ratios that professional investors use when analyzing a company are Balance Sheet and Income Statement ratios. Here are some examples of very popular and common ratios:
Liquidity Ratios:
Current ratio
Quick ratio
Cash ratio
Leverage Ratios:
Debt ratio
Debt to equity ratio
Interest coverage ratio
Efficiency Ratios:
Asset turnover ratio
Inventory turnover ratio
Receivables turnover ratio
DIO, DSO, and DPO
Profitability Ratios:
Gross margin ratio
Operating margin ratio
ROA
ROE
ROCE
These are just some examples of the most commonly used financial ratios. However, there are many more examples.
Beyond Balance Sheet and Income Statement Ratios
Today I want to focus on the cash flow statement. When it comes to doing a liquidity or solvency analysis, using the cash flow statement is a better indicator than using the balance sheet or income statement. By analyzing the cash flow statement, you can find some insights or new information that otherwise you would have omitted.
The income statement has a lot of non-cash numbers like depreciation and amortization which does not affect cash flow. On paper, and at the top of the financial statement, it may look like a company is making or losing money when you account for depreciation and amortization, the actual cash in and outflow could show a different picture.
What you want to do is differentiate between accrual accounting methods and the flow of cash.
Balance sheet ratios also have their limitations as it drills into a company's financial health at a single point in time. It gets hard when you try to calculate a consistent going concern analysis.
There are far too many cases where the balance sheet looked healthy one quarter, but then investors are met with a huge surprise as debt balloons, cash dives and the company falls into dangerous territory.
But the cash flow statement works to untangle bookkeeping numbers and the changes from the other two statements to give a number that you really care about.
In summary, revenue is vanity, profit is sanity and cash flow is king.
Cash is King
As much as Wall Street loves earnings, the core engine behind a business and earnings is cash. Cash creates earnings, earnings do not create cash.
If a business does not have cash and can’t maintain liquidity, there will be no earnings. Earnings are born from cash, not the other way around.
The purpose of these cash flow ratios is to provide as much information and detail as possible to cover all bases. That way, you can try it out yourself and pick the ones that work for you.
When using ratios, it’s important to compare ratios between competitors.
Numbers across industries and sectors will vary, so make sure you are comparing apples to apples.
Let’s dig into some of those juicy cash flow ratios.
Operating Cash Flow Ratio
Cash Flow from Operations (CFO) / Revenue
Using free cash flow (FCF) instead of operating cash flow (OCF) is a variation you can apply to most of the cash flow statement ratios.
This cash flow ratio shows you how many dollars of cash you get for every dollar of revenue.
Unlike most balance sheet ratios where there is a certain threshold you want to look for, there is no exact percentage when using this ratio. The higher the percentage, the better as it shows how profitable the company is.
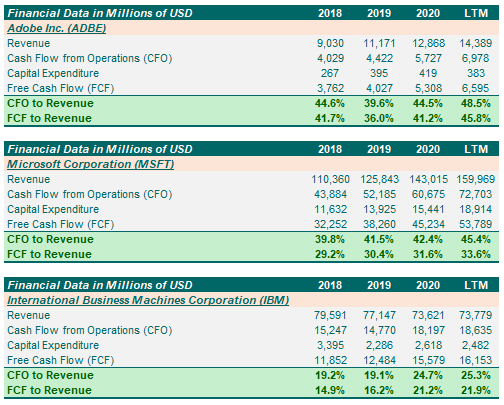
Companies with consistent CFO to Revenue ratios above 20%-30% tend to be considered cash cow businesses. When investing, you want to look for these kinds of businesses.
For instance, as you can see in the table below Adobe FCF to Revenue ratio is well above 40%. This is an outstanding percentage since it means that 40% of the revenue generated by the company, is transformed into free cash flow.
Microsoft CFO to Revenue percentage is also high, very similar to Adobe’s ratio. However, in terms of free cash flow, the percentage is lower. This comparison tells us that Microsoft is a more capital-intensive business than Adobe.
Finally, IBM has lower percentages since the business is not as good a cash generator as Adobe or Microsoft.
Source: Own elaboration
Tip: Make sure that operating cash flow increases in line with sales over time. You don’t want to see them deviate from each other too much as it could be a potential sign of weakness and inconsistency.
Asset Efficiency Ratio
Cash Flow from Operations (CFO) / Total Assets
Similar to ROA, but uses operating cash flow instead of net income.
This is a basic ratio to show you how well the company uses its assets to generate cash flow.
It’s best used to view the historical trend as well as to compare with competitors.

Source: Own elaboration
As you can see, Tesla’s asset efficiency ratio is higher than Ford’s ratio. The company has given better use to its assets to generate cash flow in comparison with Ford.
Tip: Instead of Total Assets, the ratio can be cleaned up by using just PP&E.
Cash Return on Capital Employed
Operating Income - Taxes Paid + Depreciation & Amortization) / (Total Assets + Accumulated Depreciation - Current Liabilities)
This is a formula purposed by Aswath Damodaran. He is considered “the Dean of Valuation.” If you don’t know him, I recommend you to check out his website and learn as much as you can from him. His content is completely FREE.
Cash Return on Capital Invested (CROCE) is a fantastic metric that any investor should look at. You may be more familiar with ROE or ROIC to measure business returns, but CROCE takes it a step further.
CROCE shows how much after-tax cash operating profits per dollar the business generates from gross capital employed. I find this to be a really interesting performance metric as it shows so clearly how effective management is and the strength of the business.
Here are some great examples:

Source: Own elaboration
As you can see, defensive and non-capital intensive businesses such as Adobe or Facebook have higher Cash Returns on Capital Employed (CROCE) in comparison with more cyclical and capital intensive businesses like Exxon Mobil or Chevron.
I know which type of company I would prefer to have in my portfolio.
Current Liability Coverage Ratio
Cash Flow from Operations (CFO) / Current Liabilities
or
(Cash Flow from Operations (CFO) – Dividends Paid) / Current Liabilities
The more accurate method is to subtract the cash used to pay off dividends as it will give a truer picture of the operating cash flows.
This ratio gives you an idea about the company’s debt management practices.
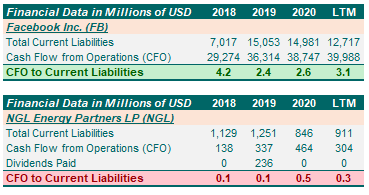
For instance, a value of 5.0 means that the current cash flows can pay for 5x the current liabilities.
The higher the number the better.
If it drops below 1, it’s a warning sign since the CFO is unable to pay the current liabilities. In this kind of situation, we shouldn’t conclude immediately that the business is having liquidity problems until we truly understand the reason for this low ratio.
Indeed, smart investors think of 10-K’s as puzzles or treasure hunts and relish the chance to dig through even the microscopic footnotes to figure out what is going on.
This ratio, it’s also a better indicator of the company’s ability to pay current liabilities than the current ratio or quick ratio.
Some examples:
Source: Own elaboration
Tip: This ratio is used to analyze the short-term stability of a company. This ratio also includes the current maturing portion of long-term debt.
Alternatives:
CFO to Short Term Debt
FCF to Current Liabilities
FCF to Short Term Debt
Long Term Debt Coverage Ratio
Long Term Debt / Cash Flow from Operations (CFO)
or
Long Term Debt / (Cash Flow from Operations (CFO) – Dividends Paid)
If you have a ratio for short-term liabilities, then it makes sense to have one for long-term debt.
A common error is bunching up all forms of debt without splitting it up.
If you only use the Debt to Equity ratio, you could get a wrong perception of the business's general solvency. That’s why to get an appropriate image you should go further and start looking at both Short Term Debt to Equity and Long Term Debt to Equity.
Again, using cash flow numbers gives you an immediate sense of whether the company can pay off the debt.
The higher the number, the longer it will take to pay off all the long-term debt with the current cash from operations generated. For instance, a value of 5.0 means that the current cash flows can pay for 5x the long-term debt.
If the ratio is trending up, management may raise more capital via dilution, or additional debt.
If a company has been carrying little or no long-term debt in the past years then there’s a good chance that the company has some kind of competitive advantage in that industry.
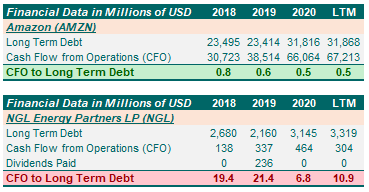
The famous investor Warren Buffet invests in businesses that have sufficient yearly operating cash flow to pay off all its long-term debt in a matter of 3 or 4 years. That’s what Warren Buffet looks for.
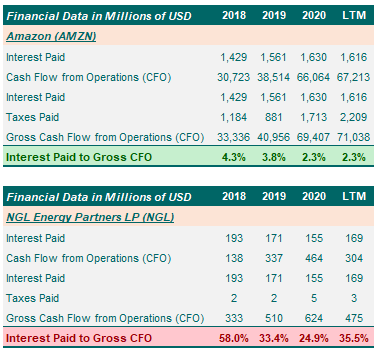
As you can see in the table below, it’s clear that Amazon enjoys a very solvent position since it can pay all its long-term debt in less than 1 year. However, NGL Energy Partners LP is in a dangerous position since it will take almost 11 years to pay all its long-term debt with the current CFO that the business generates.
Source: Own elaboration
Alternatives:
Long Term Debt/FCF
Interest Coverage Ratio
Interest Paid / (Cash Flow from Operations (CFO) + Interest Paid + Taxes Paid)
The value you get from this ratio will show you what percentage of the gross operating cash flow is used to pay financial expenses.
The ratio of interest payments to gross operating cash flow can also be very informative as to the level of economic danger the company is in.
The rule here is simple: In any given industry the company with the lowest percentage of interest payments to gross operating cash flow is likely to have a durable competitive advantage in the future.
A highly leveraged company will have a high percentage whereas a company with a solvent balance sheet will have a low percentage.
A higher percentage means a higher risk of default. For instance, a company that has to pay 100% of its gross operating cash flow in interest expenses has an extremely high risk of default.
Following the previous example, it’s clear that Amazon is a more solvent business than NGL Energy Partners LP. For Amazon, the total interest paid represents less than 3% of total gross operating cash flow whereas for NGL Energy Partners LP is more than 30%.
Source: Own elaboration
As an investor, you want to buy businesses that keep as much cash as possible into the business. If interest payments are high, cash flows generated by the company are going to bondholders and financial entities and not to the shareholders.
Alternatives:
By substituting CFO for FCF in this equation, it tells you whether the company can pay off the interest from its FCF.
Interest Paid / (FCF + Interest Paid + Taxes Paid)
Cash Generating Power Ratio
Cash Flow from Operations (CFO) / (Cash Flow from Operations (CFO) + Cash from Investing Inflows + Cash from Financing Inflows)
I love the name of this one. The Cash Generating Power Ratio is designed to show the company’s ability to generate cash purely from operations, compared to the total cash inflow.
Instead of using the entire cash from investing activities and cash from financing activities, only the inflows are used.
For instance, here’s a snapshot of Darden Restaurants’ cash flow statement.
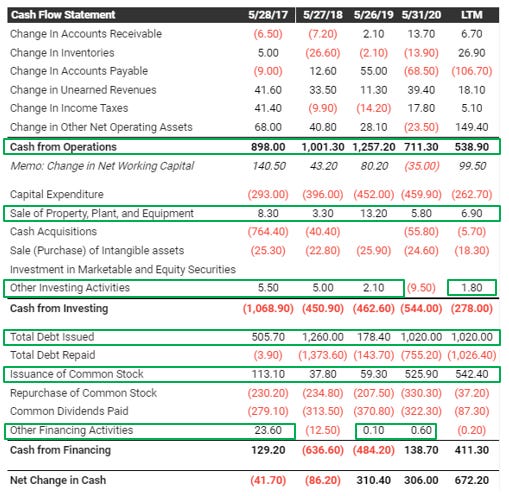
Source: TIKR
The green rows are the numbers that are used for this ratio.
Try it with one of your holdings, but here’s what I see with Darden Restaurants Inc. (DRI)
2017: 57.8%
2018: 43.4%
2019: 83.2%
2020: 31.4%
LTM: 25.5%
The numbers have been deteriorating, but if you analyze it deeper, you will see that a lot of the cash being generated is a result of issuing debt and stock.
It shows that DRI isn’t generating most of its cash from operations alone but rather they need to dip into issuing new debt and new stock to generate extra cash.
Now take a look at Domino’s Pizza Inc. (DPZ):
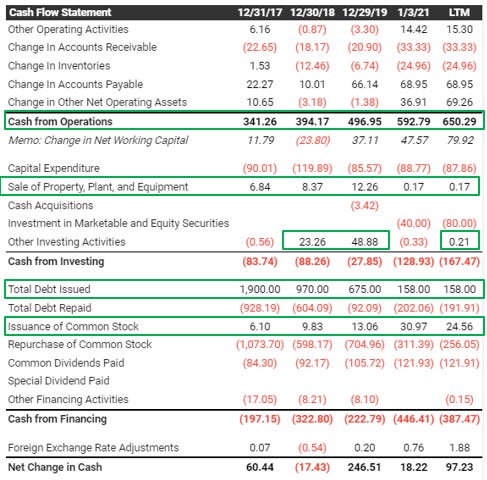
Source: TIKR
2017: 15.1%
2018: 28.0%
2019: 39.9%
2020: 75.8%
LTM: 78.0%
The numbers have been improving extraordinarily. In 2017 most of its cash flow wasn’t generated alone from its operations but since 2020 over 75% of the cash that the business generates comes from its business operations rather than external inflows.
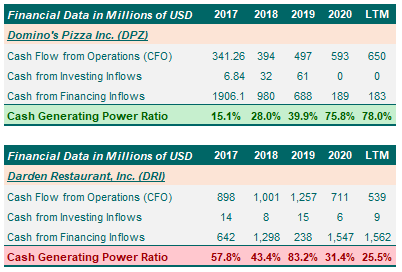
Source: Own elaboration
It’s clear to me which of these businesses I would prefer to buy.
External Financing Index Ratio
Cash from Financing / (Cash Flow from Operations (CFO)
This ratio compares the cash flow from financing activities with operating cash flow to show how dependent the company is on financing.
The higher the number, the more dependent the business is on external money.
Strong companies like MSFT and FB have negative ratios because they can pay back stock or debt so the net cash from financing is negative. You want to invest in resilient businesses that don’t depend at all on external financing.
On the other hand, finding a business with a negative External Financing Index ratio for the wrong reasons is a red flag to consider. When cash from financing is positive and cash from operations is negative, the business depends solely on external money to survive.
To help me grow this amazing community and if you enjoyed this post, make sure to share it with anyone who could benefit from it.
👉 If you enjoyed reading this post, feel free to share it with friends!
Thank you for your support, and all the best in your journey to become a successful investor.
Yours truly,
The Buddhist Investor
For more like this, make sure to subscribe here: